A Guide to ERP Reporting and Business Intelligence

Suppose you are trying to schedule a critical meeting with another department without access to their calendar. If you book it blindly, the outcome is entirely unpredictable. You can end up with overlapping commitments, frustrated colleagues, and a total calendar mess. That is exactly what running a business feels like without clear data.
Every day, your team generates piles of information from sales, inventory, and finance. But if that data stays trapped in different departments, it is useless. You need a way to clean this mess. That is where a modern ERP reporting system and smart analytics come into play. They turn raw numbers into clear roadmaps. In this blog, let’s see how you can detangle your team’s data for your business growth.
Key Takeaways
- Data silos slow down decisions whereas centralizing data fixes it.
- Standard reporting shows what happened while business intelligence shows why.
- Real-time ERP financial reporting reduces closing times and manual errors.
- The right ERP reporting tools for business growth must scale with your company.
Why Is Your Current Data Trapped in Silos?
Data silos happen when departments use separate tools that do not talk to each other. This separation creates blind spots, slows down your team, and leads to critical mistakes.
“When data is locked in separate department silos, inconsistencies inevitably follow. Gartner ranks conflicting data across different sources as the single biggest data quality challenge for businesses. Without a unified system, you end up with massive gaps, overlapping records, and data that is nearly impossible to standardize.”
Source: Data Quality Best Practices by Gartner

To understand how bad data silos hurt, let’s look at the difference between disconnected tracking and a unified ERP approach.
| Business Function | Disconnected System Output | Unified ERP System Output |
| Sales & Orders | Locked in CRM; inventory team cannot see it. | Updates inventory instantly when a sale happens. |
| Finance Tracking | Manual spreadsheets; prone to human errors. | Automated, real-time ERP financial reporting. |
| Warehouse/WMS | Disconnected logs; causes shipping delays. | Syncs with sales orders for fast fulfillment. |
| Decision Making | Assumptions based on old, outdated weekly reports. | Live dashboards powered by business intelligence. |
Root cause of data silos
Silos grow naturally when teams buy software to fix quick problems without thinking about the big picture. Over time, these small tools create a messy web that blocks communication. This makes it impossible to get a single version of the truth.
Result of fragmented tools
When your data is split up, your team wastes hours manually tracking and updating numbers between spreadsheets. This lag means you are always reacting to old problems instead of planning ahead. Missing a sudden shift in customer demand can cost you thousands in lost revenue.
Lack of a unified system
A centralized platform pulls every department into a single, shared database instantly. It acts as the digital spine of your business, keeping everyone on the exact same page. However, a lack of such a system can create havoc. When everyone is not looking at the same data, confusion rises and speed takes a backseat.
What Is the Difference Between Simple Reporting and Deep Analytics?
Simple reporting tells you what already happened in the past, like a rearview mirror. Deep analytics, however, tells you why it happened and what will likely happen next.
A good ERP software comparison report shows that basic systems only give you static summaries. To stay ahead of the game today, you need active insights that help you make smart choices before your competitors do.
Limits of static operational reports
There are multiple limitations, actually. Static reports only show you data from the past, like last month’s sales numbers. They cannot tell you why sales dropped in a specific region or help you fix it. You are left with lots of data but no clear action steps.
Business intelligence to your rescue
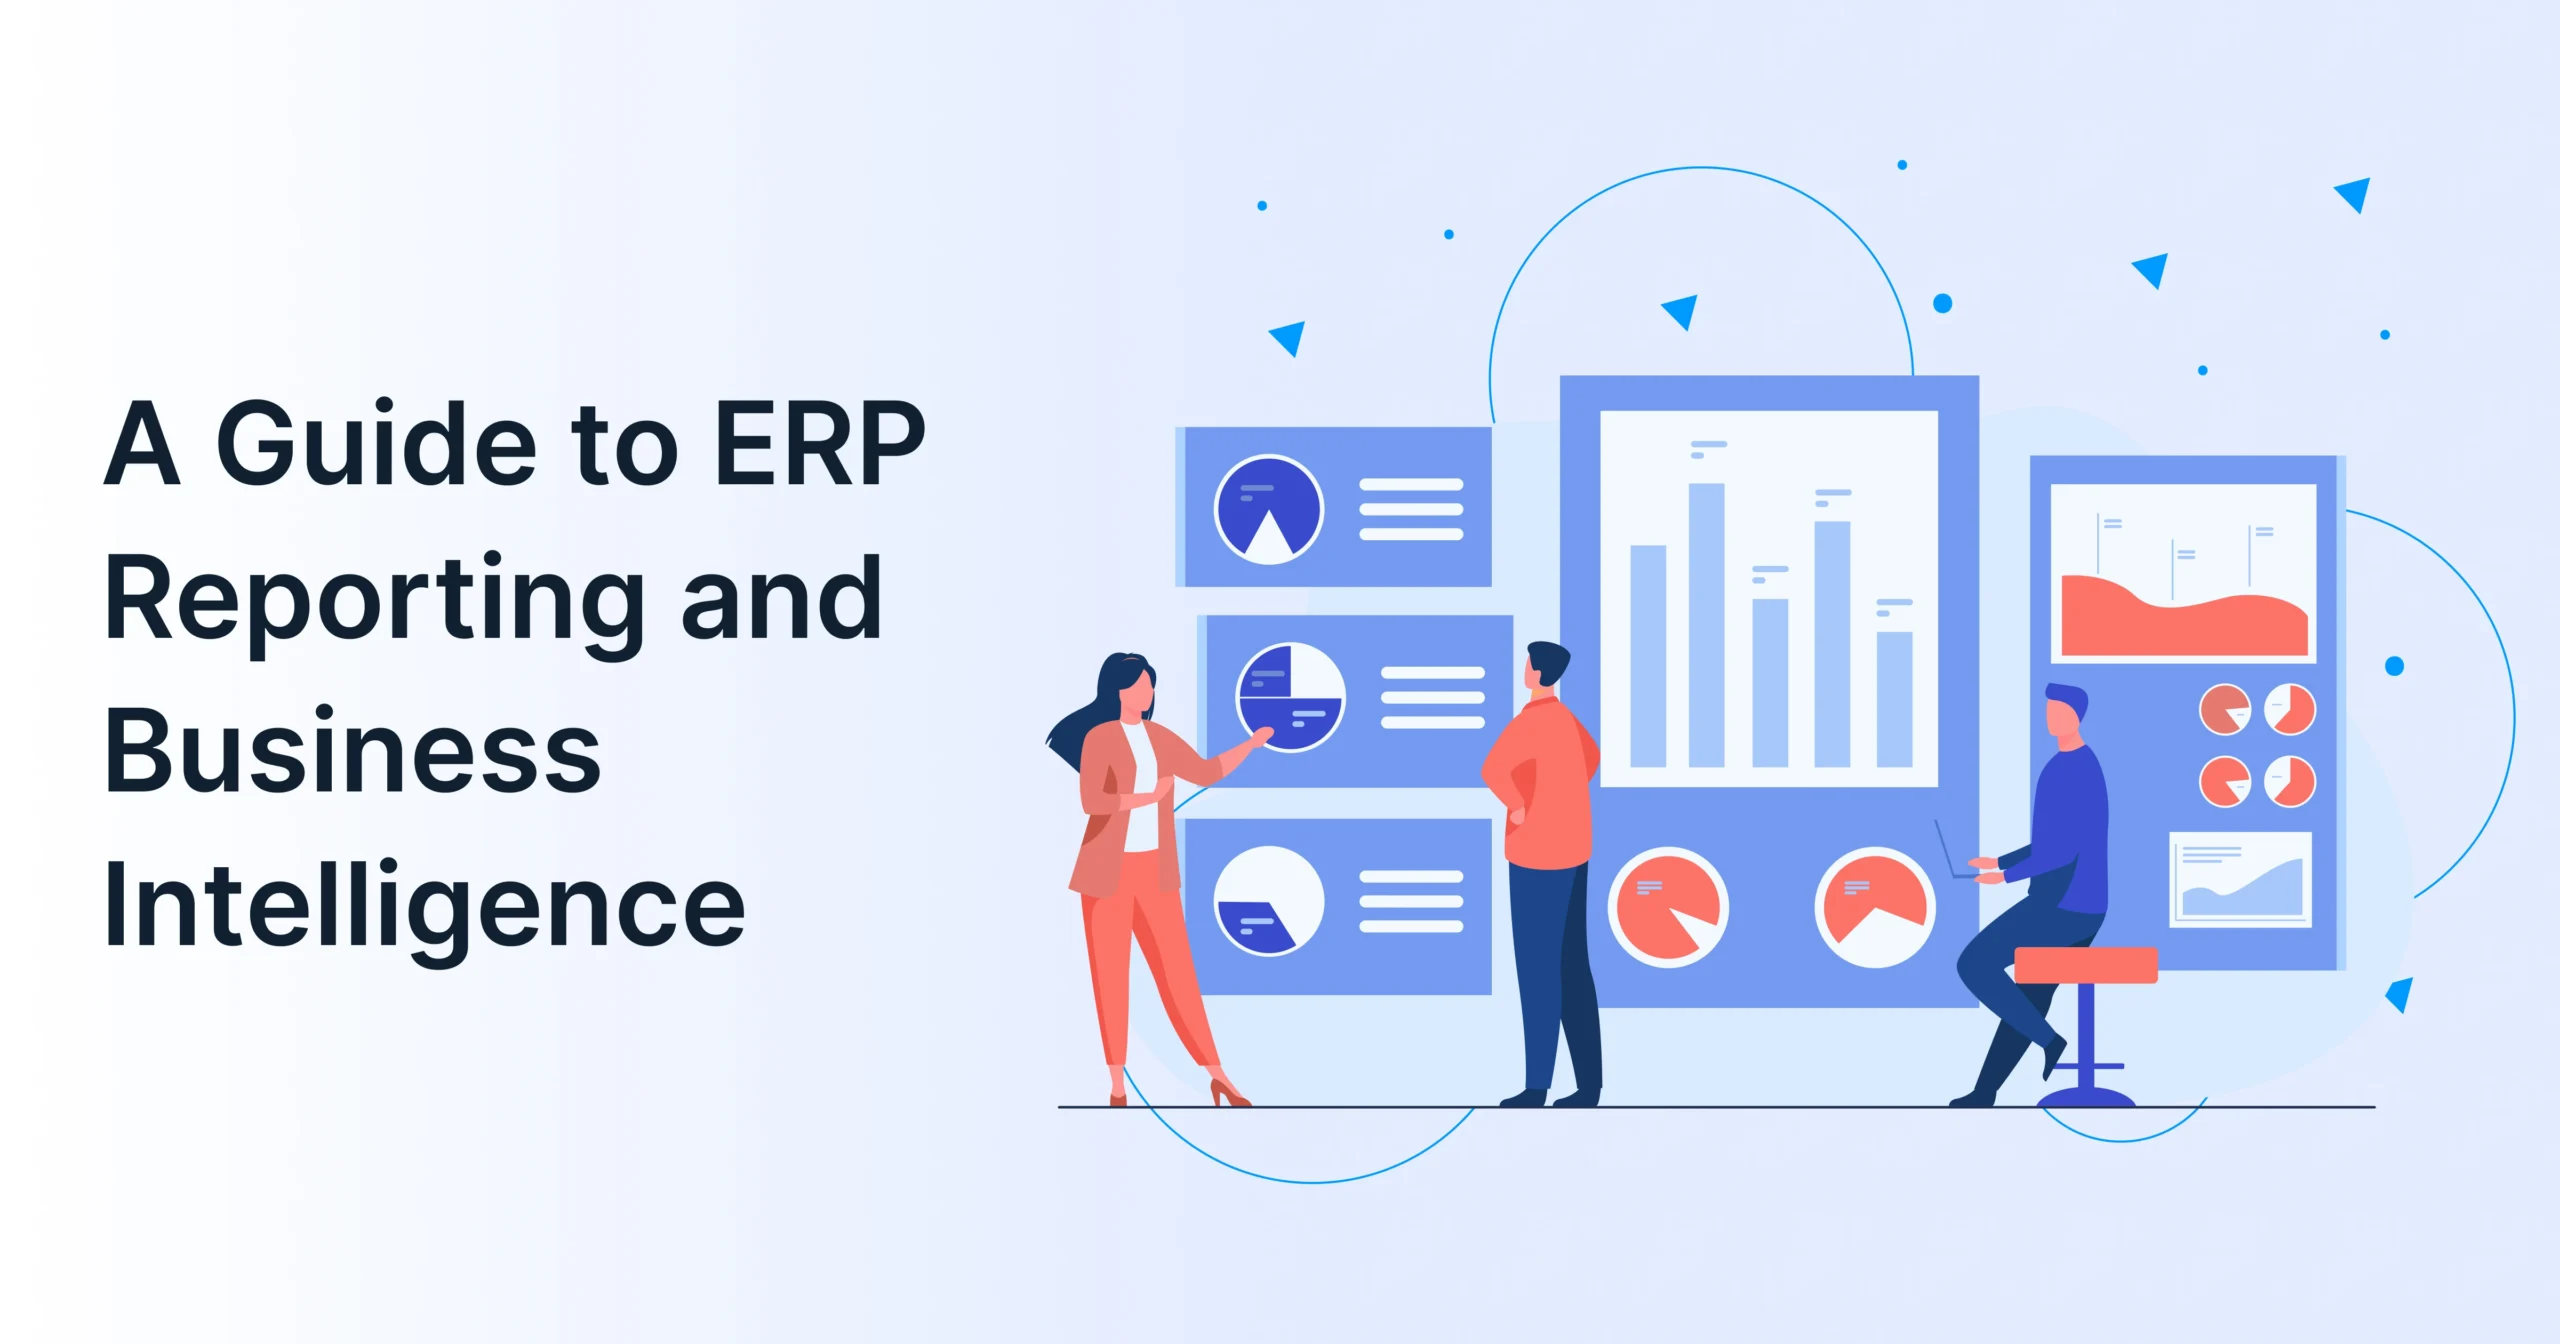
Business intelligence transforms your raw data. Modern analytics tools dig into your data to find hidden trends and patterns. They turn dry rows of numbers into visual, easy-to-read dashboards that tell a story. This lets you spot new opportunities the moment they appear. What data tools typically provide:
- Standard Reports: These are regular, automated text summaries built for daily tracking.
- Predictive Analytics: This tool forecasts future market trends using your historical data.
- Ad-Hoc Queries: Custom searches created on the spot to answer specific business questions.
- Interactive Dashboards: Visual screens that let you click and explore live business metrics.
Why do you need both tools to scale?
You need basic reports for daily tasks and advanced analytics for long-term planning. Balancing both ensures your daily operations run smoothly while you build your future strategy. It is the ultimate combination for sustainable business growth.
How Can Advanced ERP Reporting Boost Your Cash Flow?
Smart financial tracking protects your cash flow and keeps your business healthy. Advanced tools of ERP software improve business productivity by eliminating the stress of month-end closing. It does so by automating your most tedious tasks.
When you upgrade your financial view, you stop hunting for numbers blindly and start managing growth.
Impact of manual financial reporting
Chasing paper receipts and fixing spreadsheet errors wastes valuable time every single month. By the time you finish your books, the data is already weeks old. This delay makes it very hard to manage your cash flow accurately.
Effects of automated finance tracking
First of all, automation reduces human error. It pulls transactions directly from sales, purchasing, and shipping without human intervention. This stops typos, duplicate entries, and missing line items from ruining your balance sheets. Your finance team can finally breathe easy and focus on strategy. Automated tracking checks for key financial metrics like:
- Days Sales Outstanding (DSO): Measures how fast your customers pay their invoices.
- Inventory Turnover Ratio: Shows how many times you sell and replace stock over time.
- Net Profit Margin: Tracks the exact percentage of revenue left over after all expenses.
- Operating Cash Flow: Monitors the cash generated by your regular daily business activities.
What does real-time financial visibility look like?
Seeing your exact profit margins, expenses, and revenues update live with every single transaction certainly gives you the needed confidence. You can spot cash flow bottlenecks early and fix them before they become critical problems. It gives you total control over your financial future.

How Do You Choose the Right Analytics Platform for Your Business?
Choosing the right platform requires looking past flashy features and focusing on your actual business goals. The best system fits your current workflows and adapts easily as your business grows.
Finding the perfect balance between power and simplicity can feel overwhelming. In this section, we’ll learn how to choose the right ERP system for growing businesses. Let’s see the important factors you should look for in the selection process.
User adoption
User adoption should always guide your software choice. The most powerful tool in the world is useless if your team finds it too hard to use. A clean, simple interface ensures your employees actually use the system every day. High adoption rates are the secret to getting a real return on your investment. Critical features to look for:
- Custom Alerting: Sends instant notifications when metrics drop below your set targets.
- Easy Customization: Allows you to change reports without needing help from an IT expert.
Cloud solutions
Cloud solutions help you scale without interference. How? Cloud platforms grow with your business without needing expensive new hardware or servers. They let you add new users, locations, and modules whenever you need them. Plus, your team can access vital data securely from anywhere in the world. Critical features to look for:
- Role-Based Access: Keeps sensitive data safe by limiting views based on job roles.
- Mobile Access: Lets your team check vital dashboards on phones or tablets while traveling.
Smooth integration
Your new analytics engine must connect easily with your existing WMS, CRM, and supply chain tools. A fully integrated setup prevents data gaps and keeps your information flowing smoothly across the company. It turns scattered tools into a single, cohesive powerhouse.
As we have come to the end of the blog, let’s see what we’ve learnt so far.
Conclusion
Running a business without clear insights is a risk you do not have to take. A modern cloud platform connects your operations, clears away data silos, and gives you the tools to scale with confidence.
At GrexPro, we build smart, simplified cloud solutions that help businesses worldwide innovate and grow. We make complex data simple so you can focus on leading your market.
FAQs
Q: What is the main benefit of using ERP analytics over basic spreadsheets?
A: Spreadsheets are manual, prone to human error, and instantly outdated. Analytics tools give you live, automated insights that connect every department in real time.
Q: How does an ERP reporting system help my sales team?
A: It gives your sales team live updates on inventory levels, customer buying habits, and order statuses. This helps them close deals faster and avoid selling out-of-stock items.
Q: Is it difficult to migrate our old data into a new ERP platform?
A: Data migration takes careful planning, but the right partner makes it smooth. Modern cloud platforms use smart import tools to clean and transfer your data safely.
Q: Can small businesses benefit from ERP reporting tools for business growth?
A: Absolutely. Small businesses need to be agile. Using data-driven insights early helps you avoid costly mistakes and scale much faster than your competitors.
Author
Managing Director of Grexpro
Surendra Yarrum is a Business Strategist at GrexPro with expertise in ERP, CRM, and warehouse management systems, helping businesses enhance efficiency and optimize supply chain operations.